The Nifty 50 closing at 24,250.20 on July 29, 2026 — up 264.85 points, or 1.10 percent, on the day — is the kind of headline number that flashes across ticker feeds and evening bulletins without much explanation of what actually sits underneath it. For an index that functions as the default proxy for "the Indian stock market" in everything from mutual fund benchmarking to political commentary on economic performance, understanding its composition and technical positioning matters considerably more than the single-day percentage move that dominates most coverage.
The National Stock Exchange's Nifty 50 is a free-float market-capitalisation-weighted index of the fifty largest and most liquid Indian companies listed on the exchange, reconstituted periodically based on liquidity, market capitalisation and free-float criteria. That weighting methodology matters enormously for understanding why the index moves the way it does on any given day: because larger constituents carry proportionally greater influence over the headline number, a strong single-session move in a handful of the index's largest weights — historically dominated by names like HDFC Bank, Reliance Industries, ICICI Bank, Infosys and TCS — can move the entire index meaningfully even when the broader universe of Indian-listed stocks is more mixed. On July 29 specifically, technology's outsized influence was unmistakable: the Nifty IT index surged 2.32 percent, and with Infosys alone jumping over 4.5 percent, the sector's combined weighting within the broader Nifty 50 meant technology strength alone accounted for a disproportionate share of the day's total index gain, even though banking, consumer and select industrial names also participated in the advance.
Technical analysts tracking the Nifty's chart pattern through late July pointed to a market that had spent much of the month consolidating within a defined range before breaking higher. Nifty IT specifically, as a sub-index, had opened with a gap higher and rallied sharply through the session to an intraday high before settling near the day's peak — technical behaviour chartists typically read as a sign of sustained buying interest rather than a brief, sentiment-driven spike. The broader technical trend for the sector had turned bullish, with the index trading above both its 30-day and 11-day moving averages, though still positioned below its 200-day moving average — a detail suggesting the longer-term technical recovery, while genuinely underway, remains incomplete rather than confirmed. The Relative Strength Index, a momentum indicator technical analysts use to gauge whether a security or index is approaching overbought or oversold territory on a 0-100 scale, had climbed to a reading in the low 60s for Nifty IT specifically — comfortably in bullish momentum territory without yet flashing the kind of extreme overbought readings, typically above 70, that often precede a near-term pullback.
For the broader Nifty 50 index itself, market technicians identified a cluster of important levels worth watching in the sessions ahead. Immediate support for the IT-led complex sat in a defined band below the current trading range, while resistance was identified at higher levels that, if convincingly broken on strong volume, chartists suggested could accelerate the recovery and increase the probability of the index testing higher psychological round-number levels in the coming sessions — the kind of technically-defined breakout scenario that tends to attract additional momentum-driven buying once triggered, as systematic and algorithmic trading strategies that key off technical breakouts add to the move.
Sector weightings within the Nifty 50 have shifted meaningfully over the past several years, and understanding that evolution helps explain why certain days produce outsized index moves relative to what might be expected from "the market" moving as a monolithic whole. Financial services — spanning private and public sector banks, non-banking financial companies and insurance names — has long held the single largest sectoral weighting within the index, meaning banking sector performance on any given day continues to exert an outsized pull on the headline number regardless of what is happening in technology, energy or consumer names. Information technology's weighting, while smaller than financials in aggregate, has become increasingly influential during periods like late July 2026 when the sector experiences a sharp, earnings-driven re-rating, precisely because IT stocks as a group tend to move together more tightly correlated than the more heterogeneous financial services complex, which spans everything from conservative public-sector lenders to aggressive private consumer-lending NBFCs with very different earnings drivers.
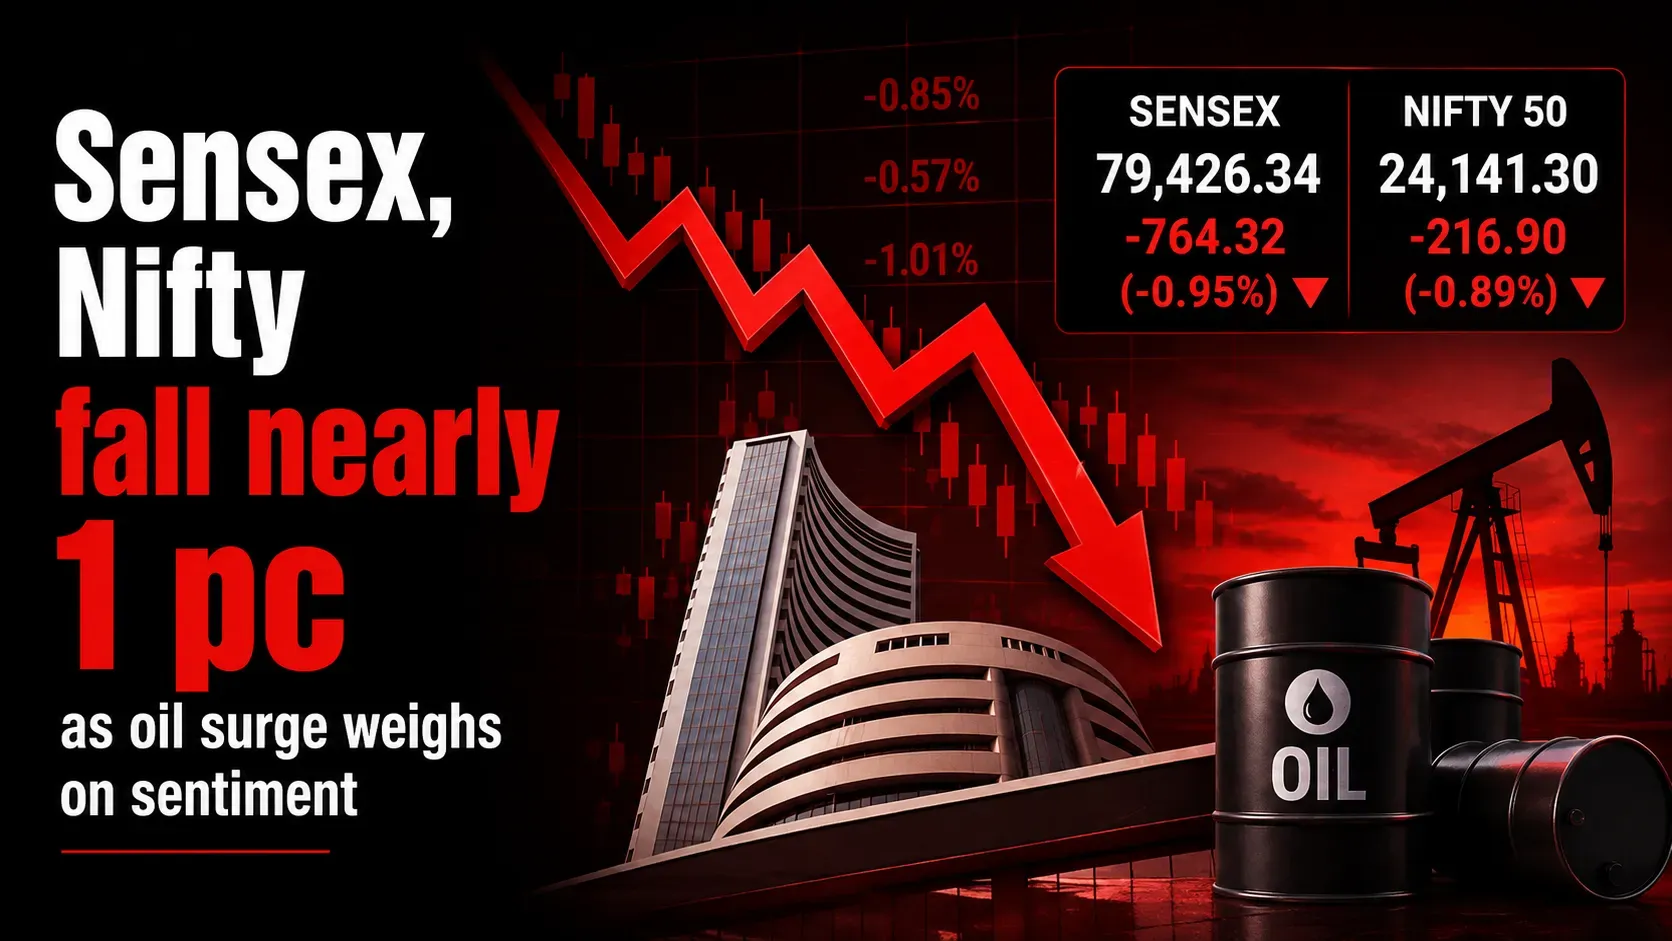
The index's forward valuation multiple offers another useful lens for understanding where the Nifty 50 currently sits relative to its own history. Following the July rally, the index's trailing price-to-earnings ratio moved higher but remained within a range most strategists characterised as reasonable rather than stretched relative to the index's own long-term historical average, particularly once adjusted for the still-elevated earnings growth several Nifty constituents — technology names chief among them, following their AI-linked deal win momentum — are now guiding toward for the remainder of FY27. That valuation context matters for the debate among portfolio managers about whether July 29's rally represents the start of a genuine, multi-month re-rating, or simply a reversion toward fair value after a period of unusually depressed technology-sector multiples driven by AI-disruption fears that this quarter's earnings season began to meaningfully dispel.
Foreign and domestic institutional positioning data offers a further layer of context for the index's July 29 move. FIIs turned net buyers in the cash segment to the tune of nearly ₹2,982 crore on the day — their largest single-session net purchase in several weeks — while simultaneously maintaining a substantial net short position in index futures, a combination derivatives desks typically read as cautious, hedged accumulation rather than an unconditionally bullish, all-in directional bet on further near-term Nifty upside. That nuance is worth holding onto for anyone tempted to read the headline 1.10 percent gain as unambiguous confirmation that foreign capital has fully re-engaged with the Indian market; the futures positioning data suggests professional money remains genuinely divided about how much further, how quickly, the index can extend its recent gains.
Looking at the index's constituent-level detail beyond the headline number also reveals useful nuance about market breadth. Advance-decline data across the NSE's broader universe — not just the fifty Nifty constituents — showed a positive ratio through the session, indicating gains were genuinely distributed across a meaningful share of listed stocks rather than concentrated narrowly in the index's largest weights. That breadth matters because narrow, mega-cap-driven index rallies have historically proven less durable than broad-based advances, precisely because narrow rallies depend on a small number of stocks continuing to perform, while broad rallies reflect a genuine, economy-wide shift in risk appetite less vulnerable to any single sector or stock disappointing in subsequent sessions.
For retail investors who track the Nifty 50 primarily through index funds, exchange-traded funds or as a benchmark for actively managed equity mutual funds, the practical takeaway from July 29's move is a reminder of how concentrated index-level performance can be around a handful of sectors and stocks in any given session, even when the underlying number looks like a smooth, broad-based 1.10 percent gain. Investors holding sector-diversified portfolios, rather than index-tracking vehicles alone, may have experienced meaningfully different returns on the same day depending on their specific sector tilts — a distinction that matters considerably more to individual portfolio outcomes than the single headline index number that dominates financial media coverage.
As the market moves into the first week of August, technical analysts will be watching closely whether the Nifty and its IT sub-index can hold above the moving-average support levels established through July's rally, or whether the move proves to be a shorter-lived technical bounce within what remains, by many measures, a genuinely range-bound and headline-sensitive year for Indian equities. The confluence of technical, fundamental and institutional-flow signals from July 29 offered a genuinely encouraging setup — but as chartists are always quick to caution, one strong session, however well-supported by the underlying data, rarely settles the question of where an index heads next on its own.
The Nifty 50's periodic reconstitution process — through which the index committee adds and removes constituents based on updated market-capitalisation, liquidity and free-float criteria — also shapes long-run index performance in ways that are easy to overlook amid day-to-day trading commentary. Over the past several years, the index has steadily increased its representation of newer-economy businesses spanning digital payments, e-commerce-adjacent logistics and consumer internet platforms, alongside its traditional core of banking, energy and industrial conglomerates — a gradual compositional shift that means the Nifty 50 of 2026 responds to different fundamental and sentiment drivers than the Nifty 50 of a decade ago. Understanding that evolving composition matters for anyone using the index as a long-term benchmark, since a sector rotation into or out of "new economy" names now moves the headline number in ways it simply would not have during earlier periods when the index skewed more heavily toward traditional industrials and public-sector banks.
Comparative index performance also offers useful context for gauging how genuinely strong July 29's move actually was. Against Asian regional peers — Japan's Nikkei, South Korea's Kospi, Hong Kong's Hang Seng — the Nifty's 1.10 percent single-session gain sat comfortably within the range of gains posted across the broader region on the same trading day, suggesting India's rally was as much a participant in a broader, region-wide risk-on shift in sentiment as it was a uniquely India-specific story. That regional framing is a useful corrective against reading any single day's Nifty performance purely through a domestic lens, when in reality a meaningful share of the move likely reflected capital flows and sentiment shifts playing out across emerging and developed Asian markets simultaneously.
The Nifty 50's relationship with its sibling indices — Bank Nifty, Nifty Next 50, and the various sectoral gauges like Nifty IT, Nifty Auto and Nifty Pharma — also deserves attention for investors trying to understand which parts of the market genuinely drove July 29's headline number. Because the Nifty 50 itself is a composite of all major sectors, its single-day percentage move inevitably smooths over what can be dramatically different performance across underlying sectoral components — a 2.32 percent single-session gain in Nifty IT is a materially different outcome than the more modest, broad-market-tracking 1.10 percent posted by the headline Nifty 50, and understanding that gap is essential for anyone trying to attribute the day's performance to specific catalysts rather than treating the market as a single, undifferentiated entity moving uniformly in one direction.
For long-term index investors specifically — those holding Nifty-tracking index funds or ETFs as a core, passive portfolio holding rather than actively trading around individual sessions — the practical takeaway from a granular look at July 29's move is less about the specific technical levels or sector attribution discussed here, and more a reminder of why index-level diversification exists in the first place: even a day when technology stocks surged and drove a strong headline index gain would have looked considerably less dramatic to an investor holding, say, a portfolio heavily weighted toward energy or consumer staples names that participated far more modestly in the same session's advance.
Ultimately, the Nifty 50's July 29 close at 24,250.20 is best understood not as a single, self-contained event but as one data point within a longer, still-unfolding chart — one shaped by earnings seasons, institutional flow cycles, global monetary policy, and the persistent overhang of trade-policy uncertainty that has defined so much of 2026 for Indian markets. Reading that single day's number in proper context, with an appreciation for the technical, fundamental and structural forces genuinely driving it, offers considerably more insight than the headline percentage change alone ever could.