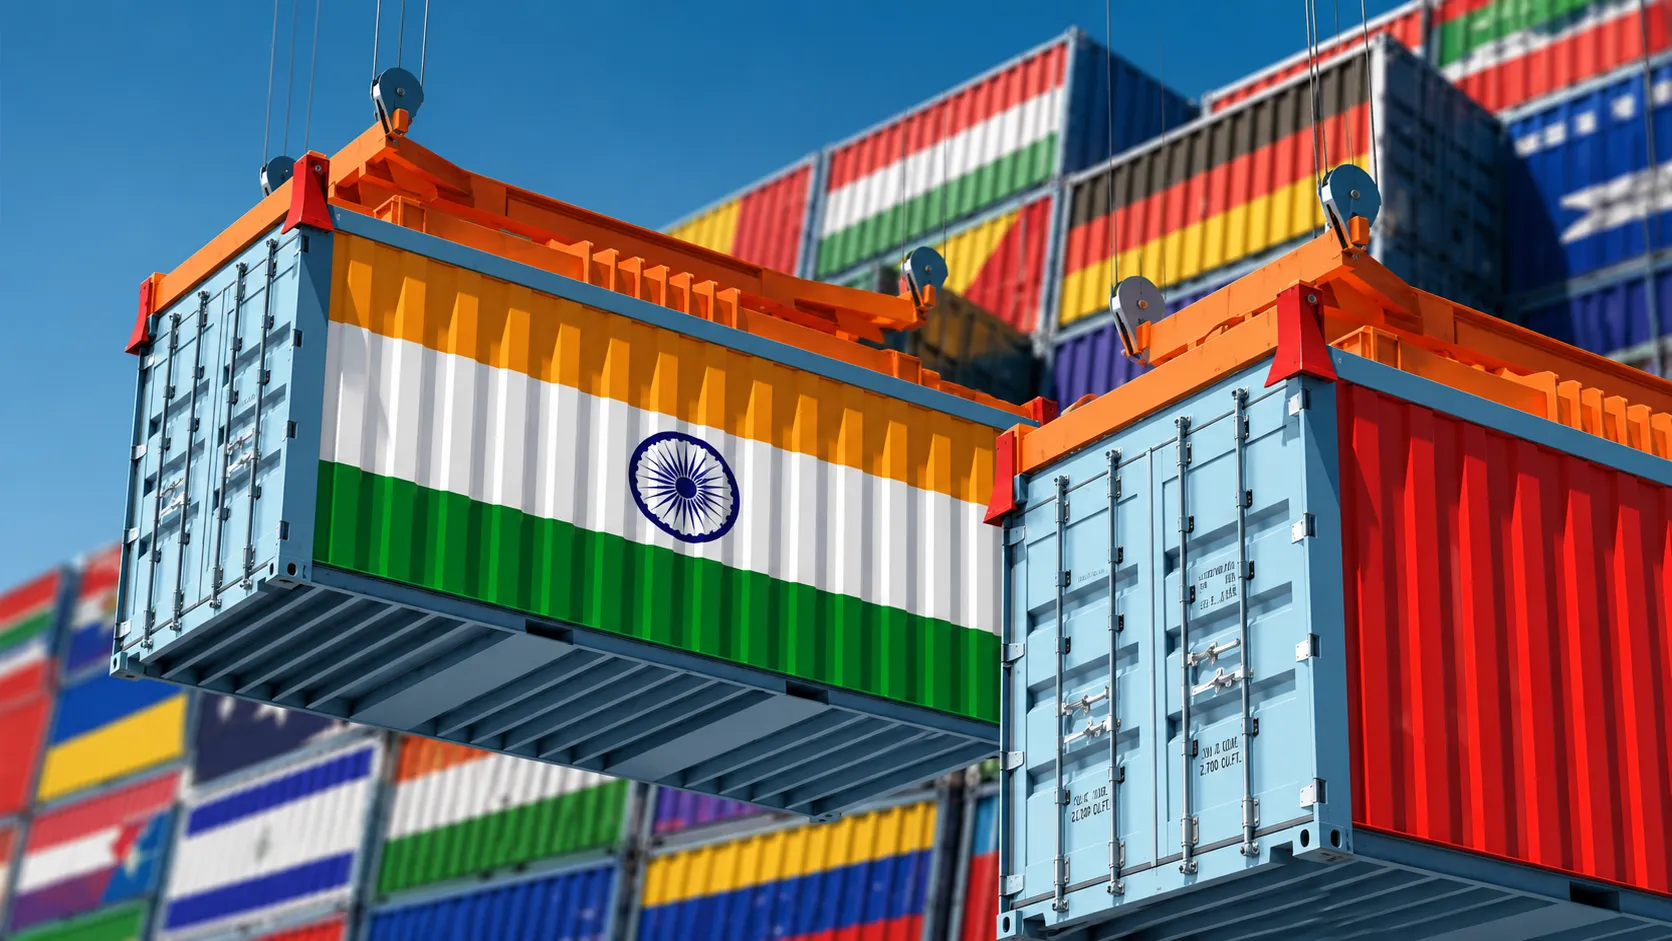
There is a number in this week's economic data release that deserves far more attention than it has received: $232.73 billion. That is the value of India's total exports — merchandise and services combined — for the April-June quarter of the current financial year, FY27, according to figures released by the Commerce Ministry. It represents the highest-ever overall quarterly export figure recorded for the first quarter of any Indian financial year, and it comes at a moment when large swathes of the global trading system remain under pressure from tariff disputes, shipping disruptions and geopolitical uncertainty in the Middle East. For a country that has spent much of the past decade trying to shed its reputation as a domestically-focused, import-heavy economy, this quarter's numbers offer some of the clearest evidence yet that India's export engine is finding real traction.
The headline growth rate — 11.37 percent year-on-year, up from $208.98 billion in the same quarter last fiscal — is respectable on its own. But the more interesting story lies beneath the surface, in the composition of that growth. Merchandise exports, the physical goods India ships abroad, rose a striking 15.92 percent to reach $129.32 billion, up from $111.57 billion a year earlier. That is a meaningfully faster pace of growth than overall exports, indicating that India's manufacturing and goods-producing sectors — not just its dominant services industry — are now doing much of the heavy lifting.
THE SECTORS DRIVING THE SURGE
Breaking down the merchandise export numbers reveals a genuinely diversified growth story, which is itself a notable shift from years past when India's export basket was often criticised for being overly concentrated in a handful of categories. Gems and jewellery exports posted the fastest growth of any major category, surging 34.64 percent for the quarter — a remarkable rebound for a sector that has weathered its share of global demand volatility in recent years. In June alone, gems and jewellery shipments jumped from around $1.79 billion a year earlier to roughly $2.41 billion.
Engineering goods, historically one of the more stable pillars of India's export basket, grew by just over 20 percent, reflecting continued global demand for Indian-made machinery, auto components, and industrial equipment. Organic and inorganic chemicals rose nearly 19.5 percent, a sector where India has steadily been building capacity as global buyers diversify supply chains away from single-country dependence. Electronics goods and rice shipments also featured among the standout performers for the quarter, underscoring how India's export mix is gradually tilting toward higher-value manufactured goods even as traditional agricultural exports like rice continue to find strong overseas demand.
Non-petroleum exports — a metric economists watch closely because it strips out the volatility introduced by fluctuating global crude prices — grew 12.44 percent to reach $106.30 billion, up from $94.54 billion in the same period last year. This is an important distinction: it shows that India's export growth story is not simply a function of refined petroleum products riding high global energy prices, but reflects genuine expansion across a broad base of non-oil manufacturing and processing sectors.
On the services side, exports rose to an estimated $103.41 billion for the quarter, up from $97.41 billion a year earlier — slower growth than merchandise exports, but still a solid contribution from India's globally dominant IT, business process management and professional services industries. The services trade surplus for the quarter came in at $49.43 billion, continuing to serve as the counterweight that has traditionally kept India's overall current account position manageable even when merchandise trade runs a deficit.
THE OTHER SIDE OF THE LEDGER: A WIDENING TRADE GAP
No trade data release is complete without examining the flip side, and this quarter's numbers carry a caveat that policymakers will need to watch closely. Total imports for the April-June period rose 17.55 percent to reach $270.15 billion — outpacing export growth and pushing the combined merchandise-and-services trade deficit to $37.42 billion, up sharply from $20.85 billion in the same quarter last year. The merchandise-only trade deficit, an even starker figure, widened to $86.86 billion for the quarter compared to $68.75 billion a year earlier.
June alone illustrated just how pronounced this imbalance had become: merchandise imports for the month surged to around $70.84 billion against exports of $40.41 billion, producing a monthly merchandise trade deficit of roughly $30.43 billion — a nearly 59 percent jump from the year-ago period. Total imports for June, including services, reached an estimated $88.76 billion, a striking 26.85 percent increase year-on-year, compared to total export growth of just 9.48 percent for the same month.
Economists tracking the release have offered a range of interpretations for the widening gap. Some of the surge in imports reflects genuinely productive economic activity — capital goods and machinery purchases tied to India's ongoing infrastructure and manufacturing investment cycle, which, if accurately captured in the numbers, represent an investment in future export capacity rather than pure consumption. Other components of the import surge, particularly gold, silver and precious metals, point to more traditional demand patterns tied to domestic consumption and festive-season stocking. Untangling how much of June's import spike reflects productive capital investment versus consumption-driven demand will be an important task for policymakers and analysts in the months ahead, particularly as the Reserve Bank of India weighs its currency and monetary policy stance against a backdrop of a weakening rupee.
WHERE INDIA IS SELLING — AND TO WHOM
The destination-wise breakdown of this quarter's export data offers a window into how India's trading relationships are evolving. The United States remained India's single largest export market during the April-June quarter, with exports worth approximately $25.47 billion, followed by the UAE at $7.95 billion, Singapore at $6.52 billion, and China at $5.60 billion. Perhaps more striking than the absolute numbers is the growth trajectory to some markets: exports to Singapore grew north of 100 percent year-on-year for the quarter, while shipments to Tanzania and South Africa posted triple-digit percentage growth, and exports to Sri Lanka rose sharply as well. Even exports to China, a market where trade dynamics have often been fraught given the broader strategic relationship between the two countries, grew by more than a quarter year-on-year.